The birds of Cheshire and Wirral
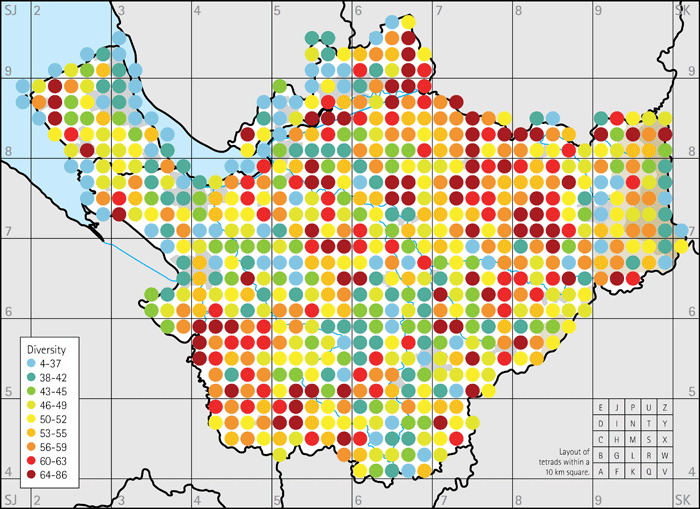
Even within a relatively small area like Cheshire and Wirral, there can be large differences in the numbers of species from one tetrad to another, depending obviously on the diversity of habitats present. The map of species richness shows the tetrads allocated by their total number of species in the breeding season, in any of the three categories of confirmed/ probably/ possibly breeding, displayed in nine bands with equal numbers of tetrads in each. In the breeding season, tetrads vary from holding four breeding species up to 86, with the regions of greatest avian diversity in the northeast and southwest of Cheshire, and isolated hotspots elsewhere, including most of the county’s well-watched bird sites in the top two bands. The most impoverished areas are the highest parts of the eastern hills and a band running from south Cheshire to the north Wirral. The urban areas, especially of Halton and eastern Wirral, hold fewer species; indeed few parts of the Wirral, with its paucity of rivers and waterbodies, reach the higher levels of diversity.

Figure 1: Species richness in the breeding season.
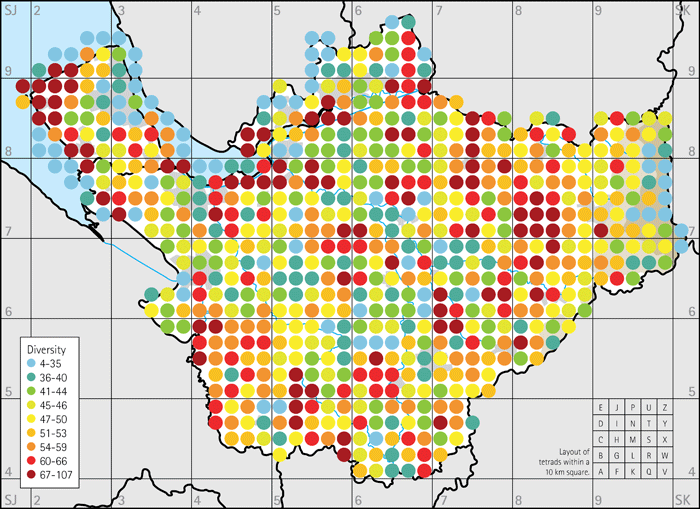
In winter, tetrads hold from four to 107 species, with still generally higher numbers in the northeast and southwest of Cheshire, but at this season the south Mersey, northwest Wirral and some of the meres and flooded sand quarries come into prominence. The map of winter species richness, plotting the number of species present in each tetrad in winter, shows that the areas of lowest bird diversity include the extremes of altitude, the eastern uplands and the estuarine intertidal tetrads, with generally fewer species in the northern and western areas of Cheshire.

Figure 2: Winter species richness.
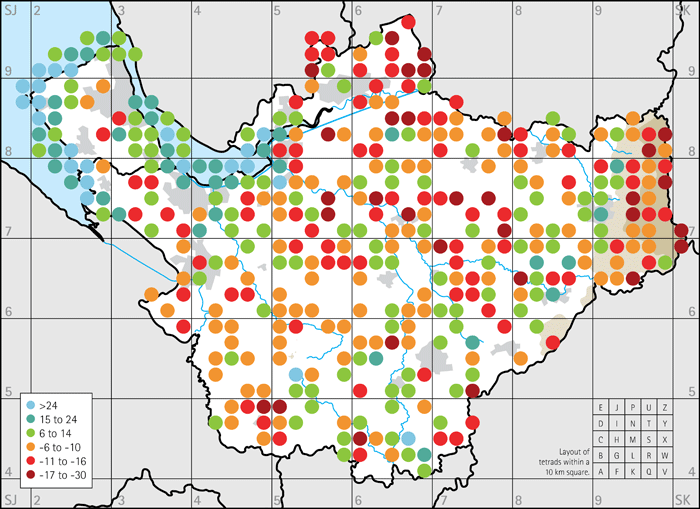
Fortuitously, very similar numbers of records were received for the two seasons, 34,516 unique records in the breeding season and 34,237 in winter, although of more species (183) in winter, compared to 153 breeding. A straightforward subtraction of the number of species breeding from those present in winter yields the map depicting the difference ‘winter minus breeding’. 270 tetrads held more species in winter, with 30 the same in both seasons and 384 tetrads held fewer in winter than breeding. 295 tetrads held similar numbers of species, in the range from five more to five fewer, and these are not plotted on this map. The map graphically shows the shift in bird distributions from breeding to winter seasons, well known to birdwatchers, from the hills to the coast, and winter is the season in which the Wirral comes into its own for birds in the county.

Figure 3: Winter minus breeding.
These maps are of all species and more sophisticated analyses can be performed of the distribution of various groups of birds.

