Recording of breeding status
We wanted to measure the distribution and abundance of the county’s birds. Probably the most scientifically valid method of doing this is to undertake timed counts. During the planning stages, however, it was felt that this would be too prescriptive and deter potential volunteers, so observers were permitted to visit their tetrads as often as they wished, and to spend as long as they wanted on survey visits. The minimum to achieve reasonable coverage was stated to be two survey visits, at least four weeks apart, once between the beginning of April and middle of May, and once from the middle of May to the end of June, with such visits lasting at least two hours to stand a reasonable chance of finding all species. During each visit observers were urged to visit every type of habitat within the tetrad that is likely to hold any different species. We described the breeding season as being ‘from April to the end of June, with adjustments being made for late and early breeders’. It may have been a mistake to mention specific months, because some observers who had been unfamiliar with birds’ breeding biology may have taken these dates too literally and thus missed some of the early and late breeding species.

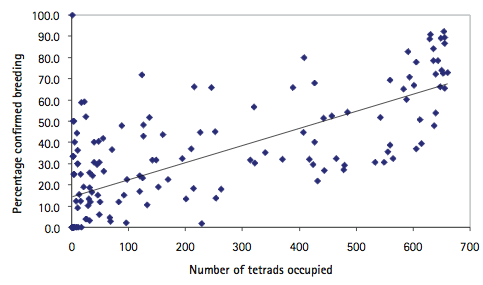
Figure 1: The relationship between the proportion of confirmed breeding and ubiquity of species
in this Atlas.
The main advantage of timed counts is that they allow a rigorous determination of abundance. We decided not to use records from all tetrads for this, but to work with a sample from areas within the county covered for the national Breeding Bird Survey (see later – Estimating population size of common and widespread birds in Cheshire and Wirral).
The first national bird atlas (1968-72) established the three-category system of confirmed, probable and possible breeding, according to a variety of behaviour indicating different levels of certainty of breeding. This scheme has been widely used, including in our First Atlas, and has been adopted as a recommended standard by the European Bird Census Council. A number of atlases, starting with the BTO’s second national survey (1988-91), have adopted a two-level method of ‘breeding’ or ‘present’, with the former amalgamating the confirmed and probable categories. This system was felt to be preferable in shifting the emphasis onto measuring ‘abundance’, using a method of relative distribution (how many tetrads were occupied within a 10-km square), rather than obtaining breeding evidence. This two-level system was adopted for very good reasons, but David Gibbons, national organiser of the BTO Second Atlas, has said (personal communication) that he now wishes that the standard three-category system had been used for that survey.
During the planning stages of our atlas, we debated long and hard which protocol to use, and eventually decided to require observers to record the highest level of the 16 breeding status codes, which could later be converted to a two- or three-level system. Some of the difference between breeding status codes is a matter of the species’ biology and some is a matter of observer competence or experience, or indeed luck, and we waited to see what results were returned before eventually deciding to use the three-level system throughout this Atlas.
We did not, however, adopt one measure of probable breeding from the EBCC list, T – permanent Territory presumed through registration of territorial behaviour (song etc.) on at least two days, a week or more apart, at the same place. This code was also not used in the BTO Second Atlas; since, to maximise participation, we specified a minimum of just two visits, at least four weeks apart, it was felt that surveyors would thus be unlikely to record the same individual singing. In any case, there are doubts about the validity of this category as an indicator of ‘probable breeding’ as persistent song can indicate a pair, but for many species the males go quiet after pairing so a persistently singing male is likely to be unmated. The only difference is that singing birds (‘S’) were counted in the lowest category of breeding.
We also felt that it was important to record the exact breeding status code, rather than just ticking a box in one of two or three columns as has been done in some other atlases. This had a number of advantages: it allowed a small number of records to be followed up for more information, or mistakes to be corrected; it has been interesting and informative to see the different status codes recorded for different species; it has allowed us to map some species in different ways, especially the colonial nesters that were widely spread in areas where they were not breeding (e.g. Swift, Rook, Grey Heron); and it would allow retrospective analysis or reclassification at a later date if desired.
It is clear from the Atlas results that there is a strong relationship (R2 = 0.52) between ubiquity and the proportion of confirmed breeding, as shown in the following graph: the more common a species, as measured by how widespread it is, the more chances that an observer has to record breeding behaviour.

