Progress of fieldwork
The spread of effort, across the county and across the years, was quite even. Breeding season records from dedicated tetrad visits were received in 2004 from 414 tetrads, in 2005 from 400 and in 2006 from 416 tetrads; including supplementary records those figures go up to 505, 518 and 550 tetrads respectively. 188 tetrads were recorded as having dedicated visits in all three seasons, 196 in two seasons and 273 in one season. The running total of tetrads that had received dedicated visits was 414 in 2004, 530 in 2005 and 661 in 2006 (see maps).
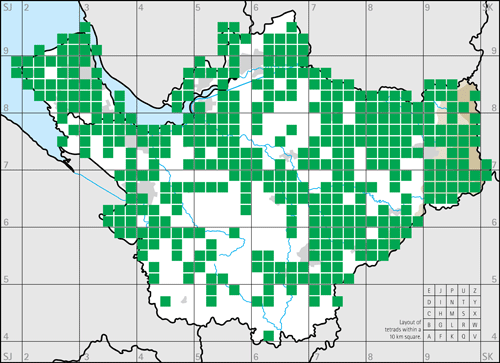
Figure 2: Breeding tetrads with dedicated visits—first year.
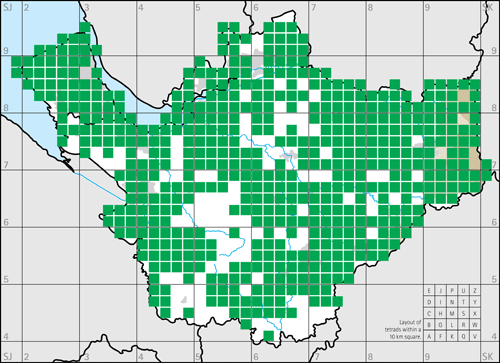
Figure 3: Breeding tetrads with dedicated visits—first two years.
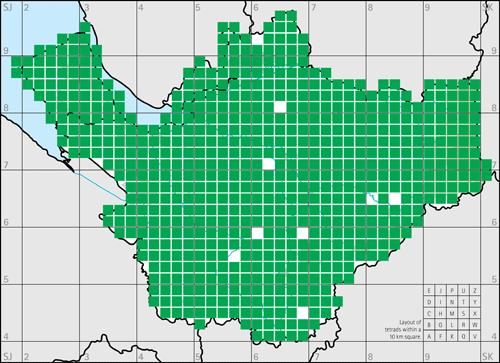
Figure 4: Breeding tetrads with dedicated visits—all three years.
Although the organisers and Atlas Steering Group had made strenuous efforts to ensure complete coverage during the three breeding seasons, including checking in May 2006 with Area Coordinators that all remaining tetrads were in fact being covered, it became clear during autumn 2006 that not all tetrads had in fact been visited. Nine tetrads, scattered across the county, had received no dedicated recording effort at all in any of the three years. These were surveyed in 2007 by members of the Atlas Steering Group or selected experienced observers; at the same time, the opportunity was taken to make additional visits to a further 14 tetrads where far fewer species had been recorded than expected. It is not felt that this small element of additional effort in 2007 significantly biased the results. Out of the final total of 34,516 unique breeding records, 12,334 (35.7%) were from 2004, 8,572 (24.8%) from 2005, 12,668 (36.7%) from 2006 and 942 (2.7%) from 2007. 30,191 breeding records (87.5%) came from dedicated visits to tetrads and 4,325 as supplementary records. Of the 18,535 confirmed breeding records, 6,618 (35.7%) were from 2004, 4,591 (24.7%) from 2005, 6,909 (37.4%) from 2006 and 417 (2.2%) from 2007.
For all species, the highest levels of the various breeding status codes recorded were:
| Breeding Status Code | Total | % | |
|---|---|---|---|
| Possible breeding | H Species present in suitable nesting Habitat; no other indication of breeding | 5,031 | 14.6 |
| S Singing male heard, or breeding calls heard | 3,905 | 11.3 | |
| Probable breeding | P Pair observed in suitable nesting habitat | 4,369 | 12.7 |
| D Display or courtship | 885 | 2.6 | |
| N Bird visiting a probable Nest site | 699 | 2.0 | |
| B Birds seen Building a nest, carrying nesting material, or excavating nest cavity | 447 | 1.3 | |
| A Agitated behaviour or anxiety calls from adults suggesting a nest or young nearby | 612 | 1.8 | |
| I Active brood patch on trapped bird, probably Incubating | 33 | 0.1 | |
| Confirmed breeding | DD Distraction Display or injury-feigning from adults | 94 | 0.3 |
| UN Recently Used Nest (used this season), or egg-shells | 94 | 0.3 | |
| ON Occupied Nest in use (e.g. high nest or nest-hole whose contents cannot be deduced) | 2,413 | 7.0 | |
| FY Adults carrying Food for Young | 4,320 | 12.5 | |
| RF Recently Fledged young, still dependent on parents | 6,258 | 18.1 | |
| FS Adults carrying Faecal Sac away from nest site | 110 | 0.3 | |
| NE Nest with Eggs, or adult sitting on nest | 869 | 2.5 | |
| NY Nest with Young, or downy young of nidifugous species | 4,377 | 12.7 | |
Table 1: The highest level of breeding status code recorded during this Atlas.
| This Atlas (2004-06) | First Atlas (1978-84) | |||
|---|---|---|---|---|
| Confirmed breeding | 18,535 | 53.7% | 21,501 | 61.4% |
| Probable breeding | 7,045 | 20.4% | 7,863 | 22.5% |
| Possible breeding | 8,936 | 25.9% | 5,630 | 16.1% |
| Total | 34,516 | 100.0% | 34,994 | 100.0% |
Table 2: Comparison of the results for breeding category in this three-year Atlas and our seven-year First Atlas.
The lower proportion of confirmed breeding during this Atlas is almost certainly because of the shorter time span of this survey (three years compared to seven years for our First Atlas). To prove breeding in some species requires an element of luck, or increased familiarity with their habits, or improved proficiency at detecting aspects of their behaviour; all of these increase with time. During this Atlas, the proportion of confirmed breeding after the first season was 43.8%, rising to 48.8% after two years’ records and 53.7% at the end of the survey.
Winter records from dedicated tetrad visits were received in 2004/ 05 from 373 tetrads, in 2005/ 06 from 431 and in 2006/ 07 from 430 tetrads; including supplementary records those figures go up to 471, 525 and 565 tetrads respectively. 163 tetrads were recorded as having dedicated visits in all three winters, 237 in two of them and 284 in just one. The running total of tetrads that had received dedicated visits was 373 in 2004/ 05, 548 in 2005/ 06 and 684 in 2006 (see maps). Out of the final total of 34,237 unique winter records, 10,747 (31.4%) were from 2004/ 05, 12,135 (35.4%) from 2005/ 06 and 11,355 (33.2%) from 2006/ 07. Being forewarned with the experience from breeding season 2006, and knowing that having to delay any winter visits to 2007/ 08 would have directly impacted on the publication schedule, we applied even tighter control on ensuring full coverage by the third winter season, including flying visits to a few tetrads where the observer or Area Coordinator did not respond to requests for information. Thus, full coverage of all tetrads in the county was achieved in three winters. 29,841 winter records (87.2%) came from dedicated visits to tetrads and 4,396 as supplementary records.
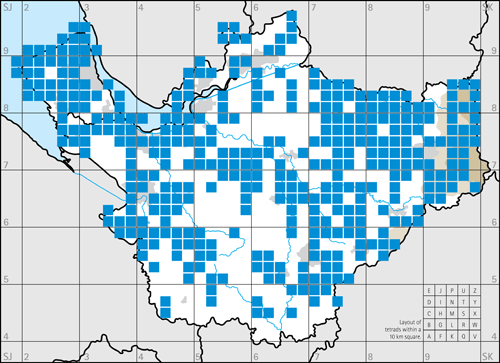
Figure 5: Winter tetrads with dedicated visits—first year
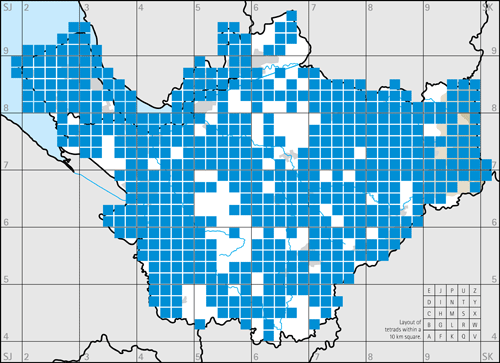
Figure 6: Winter tetrads with dedicated visits—first two years.
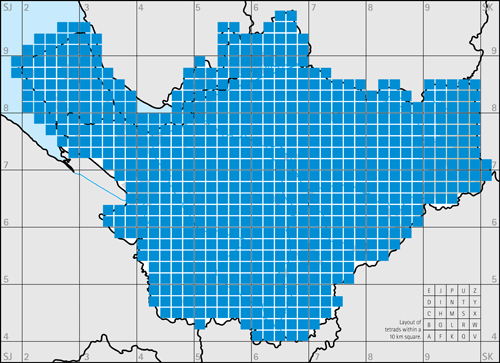
Figure 7: Winter tetrads with dedicated visits—all three years.
Fieldworkers submitted the results to their Area Coordinators who acted as the first layer of ‘quality control’, checking the data for any possible mistakes and querying unexpected records. Most data were submitted electronically using the spreadsheets supplied; an estimated one-quarter of records came in on paper, being transcribed by Area Coordinators, Steering Group members or a volunteer. In the first year, all data were checked by David Norman; after that, Steve Barber took over that role with David Cogger ensuring that all submissions were acknowledged. This provided an extra layer of data validation. All records were added electronically to the Atlas database, which then allowed rapid analysis, production of some preliminary maps and provision of feedback to participants, mainly by occasional newsletters and talks from the Atlas Coordinator.
Although it was felt that the data validation was an important step in ensuring the quality of the records, modifications to submitted records were kept to a minimum and amounted to less than 1% of the total. Reasons for changes included transcription errors, such as incorrectly entered species, tetrads or codes; elimination of double-counting of scarce species nesting in one tetrad but recorded feeding or with fledged young in an adjacent square; downgrading of some probable breeding to possible, especially where observers commented that they had used the code D for song flights of single birds, and where P had been used for observations of two or more birds, not necessarily paired (although most of these records had no comments and have been left as submitted with a comment in the species text); and some adjustment between H and O, in both directions, based on knowledge/ assessment of breeding habitat and likelihood of breeding. Additional reasons for changes to winter records included deletion of records from dates outside our defined winter period; removal of a few records stated to be from wildfowl collections; and correction of F codes to U for some species seen in flight but obviously using the tetrad.
Confidential records
A small number of breeding season records, fewer than 20 in total, were initially submitted in confidence. It is sad to report that the reason for such submissions was usually that the observer feared disturbance to the birds by irresponsible birdwatchers. However, after seeing the maps of all records, all those who had originally submitted confidential data then agreed to publication. All records in this Atlas are mapped accurately.

