Comparison with population estimates from our First Atlas
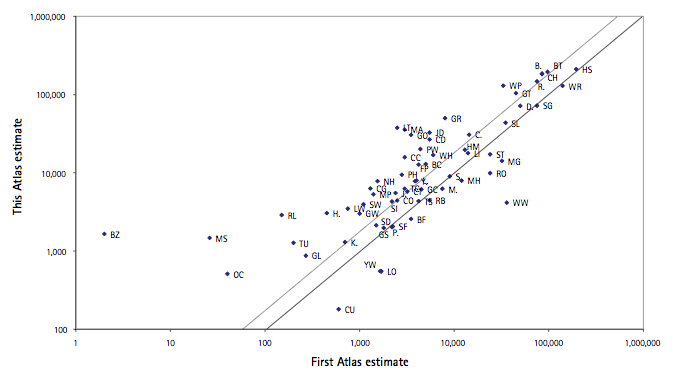
Most population estimates presented in our First Atlas were of breeding pairs. For comparative purposes, we multiplied these by two to get estimates of the number of individual birds, taking the mean figure when a range was given. However, these figures are not likely to be comparable for species which do not breed in their first years and for which there is a significant non-breeding component to the population. These caveats notwithstanding, the figures from the two atlases are plotted in the figure for the 65 species for which the BBS/ ELS analysis worked. The solid line indicates a total the same in both surveys, with the dotted line showing the present figure twice that for 1978-84. The present estimates are higher for 50 species and lower for 15. It seems implausible that the populations of so many species have risen, and that so few have fallen; the grand total of all the estimates for this Atlas is 2,022,880 and for our First Atlas is 1,213,788 individuals. The most parsimonious explanation of these figures is that many of the population figures presented in our First Atlas, although thought to have been reasonable at the time, were likely to have been underestimates. One of the reasons for thinking those figures to have been suspect is that several species that are clearly declining in fact appear to have almost identical populations to twenty years ago, including Starling (SG), Skylark (S.), Tree Sparrow (TS), Spotted Flycatcher (SF) and Grey Partridge (P.).

Figure 9: Comparison, for 65 species, between the county population estimates in this Atlas and our First Atlas.
Nevertheless, there are some species whose breeding population has increased or decreased substantially: those that have increased are to the top left of the lines in the figure, and those that have decreased are to the bottom right. Six species have apparently increased by more than one order of magnitude (i.e. at least tenfold). Ranked by the ratio of the estimates from this Atlas to that from the First Atlas, these are Buzzard (BZ), Mute Swan (MS), Red-legged Partridge (RL), Long-tailed Tit (LT), Oystercatcher (OC) and Mallard (MA). The first four are certainly known to have increased greatly, and populations of Oystercatcher and Mallard certainly have risen, although a factor of ten seems improbable. The next in order, in a group indicating rises of between fivefold and tenfold, are Goldfinch (GO), Grey Heron (H.), Tufted Duck (TU), Greenfinch (GR), Jackdaw (JD), Chiffchaff (CC) and Nuthatch (NH); again, all seven have risen in county breeding population in the last twenty years, but there is likely to be a mixture of real increases and underestimates in 1978-84. The next group of thirteen species, with calculated increases ranked from a factor of 5 to a factor of 2.5, comprise Canada Goose (CG), Collared Dove (CD), Lesser Whitethroat (LW), Pied Wagtail (PW), Woodpigeon (WP), Meadow Pipit (MP), Sedge Warbler (SW), Pheasant (PH), Grey Wagtail (GL), Feral Pigeon (FP), Garden Warbler (GW), Whitethroat (WH) and Blackcap (BC). Out of this list it seems likely that Lesser Whitethroat, Meadow Pipit, Sedge Warbler, Feral Pigeon and Garden Warbler may well have been significantly underestimated twenty years ago, but that the others have genuinely increased a lot.
Those at the bottom of the list, whose breeding population appears to have fallen the most, include Willow Warbler (WW), Yellow Wagtail (YW), Song Thrush (ST), Bullfinch (BF) and Reed Bunting (RB), all known to be declining, although the presence of Curlew (CU) and Little Owl (LO) towards the head of that group is more surprising. Magpie (MG) is unexpected below the line, but the presence of Rook (RO) and Moorhen (MH) may well indicate real declines and their county populations should be better studied.

